MaidMaps™ is a Web-based SCADA application that allows users to remotely view flows, levels, alarms and other important data.
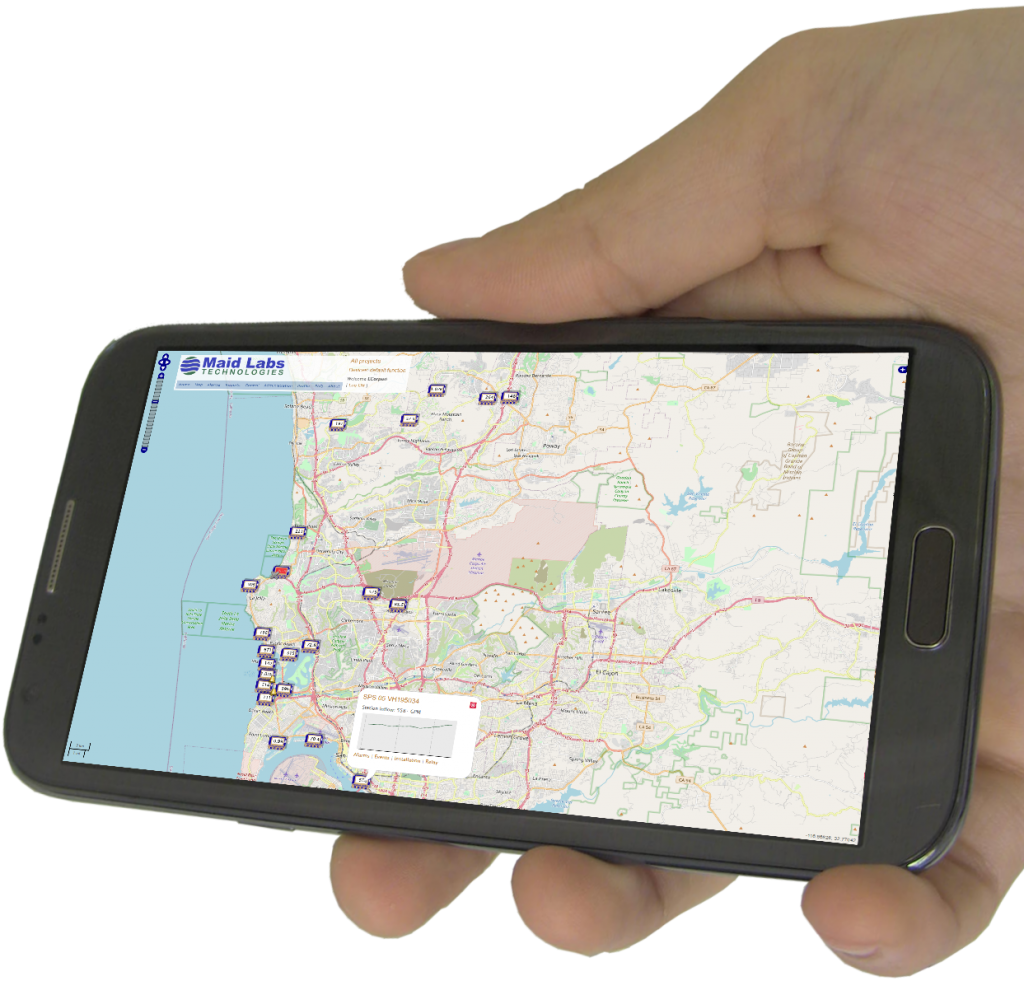
MaidMaps is a Web-based SCADA application that allows users to remotely view on their computers, tablets or phones, the following data in real time: flows, levels, alarms and other important data. The information displayed is recorded by Maid Labs devices. This SCADA software indicates on a user editable map the location of the instrument and the current measurement values.
Real time data viewing, reports and alarm monitoring
To remotely set up and retrieve data from any number of Maid Labs Devices using an Ethernet, Wi-Fi or cellular connection
All data can be downloaded for backup and analysis purposes
MaidMaps can display graphically all types of measurements listed here. It’s easy to zoom in and to go straight to a day or week of interest. It is one click away from having it exported to Excel with the data table used to create the graph.
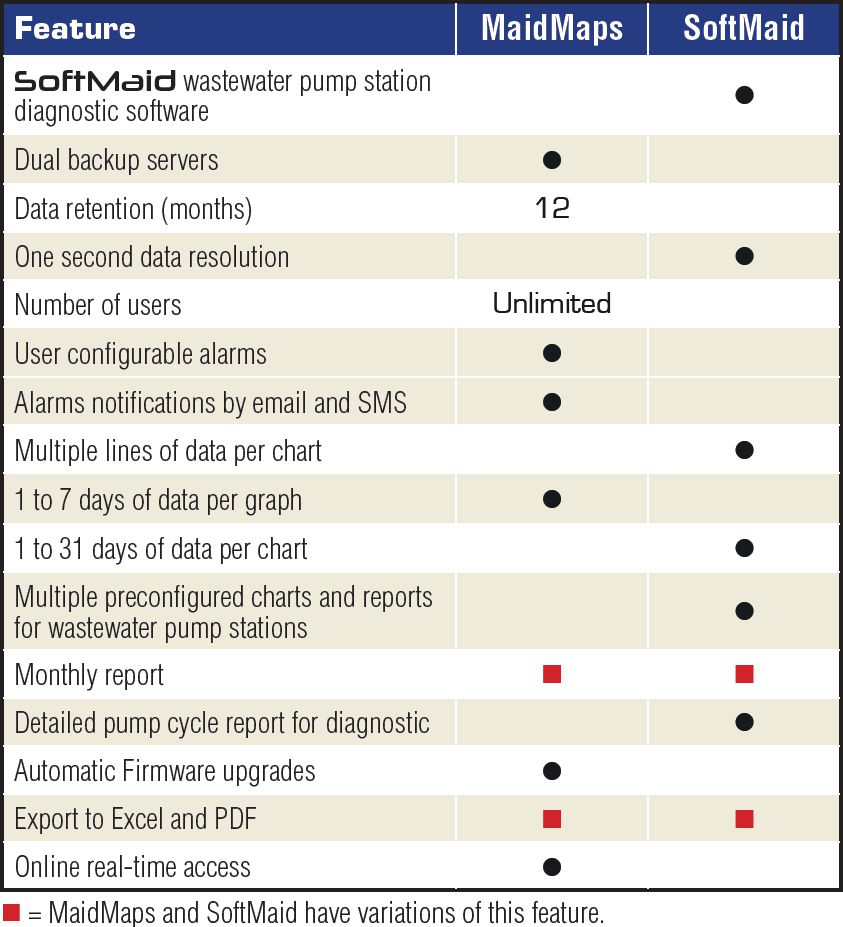
MaidMaps can be used to download SoftMaid™ compatible files from the VolucalcHybrid™ instruments.
View real flow during long cycles.
MaidMaps™ is useful to download an upload instrument configurations and firmware upgrades. It is the most popular add on to MaidLabs Technologies’ instruments.
Complete Menu
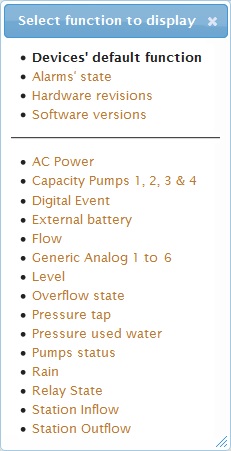
The MaidMaps™, Menu allows the creation of user profiles, instrument and alarm configurations, selection of graphs and data tables to be displayed, and files to be downloaded or uploaded. The table to the right shows the types of data that can be graphically displayed and recorded by the Volucalc Hybrid™ instruments.
Measurements
Default types of measurements, like the flow for a flow meter, are displayed based on the model of the instrument and the “project” selected. A project can be tap water pressure, waste water collection or other names given by the user, so qualified employees view only meaningful information. The list on the previous page shows all the different types of data that can be displayed on the map, which can be edited by the user.
Alarms
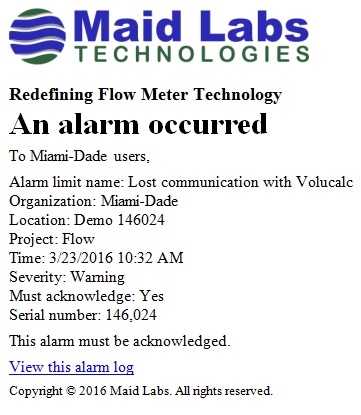
The Alarm log displays all alarms in chronological order and who took care of it based on their login access. It shows when and who received alarms and if and when they were acknowledged. Recipients receive emails like this one, even if the problem is a communication problem.
The following alarms are detected automatically by the Volucalc Hybrid™and reported by MaidMaps™:
Abnormal cycle
Abnormal pump sequence
AC power lost
Device restart
Ethernet communication problem
Inflow out of range
Level drops without pumps in operation
Long cycle
Operation level changed
Pump outflow out of range
Pump capacity changed
Short cycle
Level not changing
User defined alarms
Communication
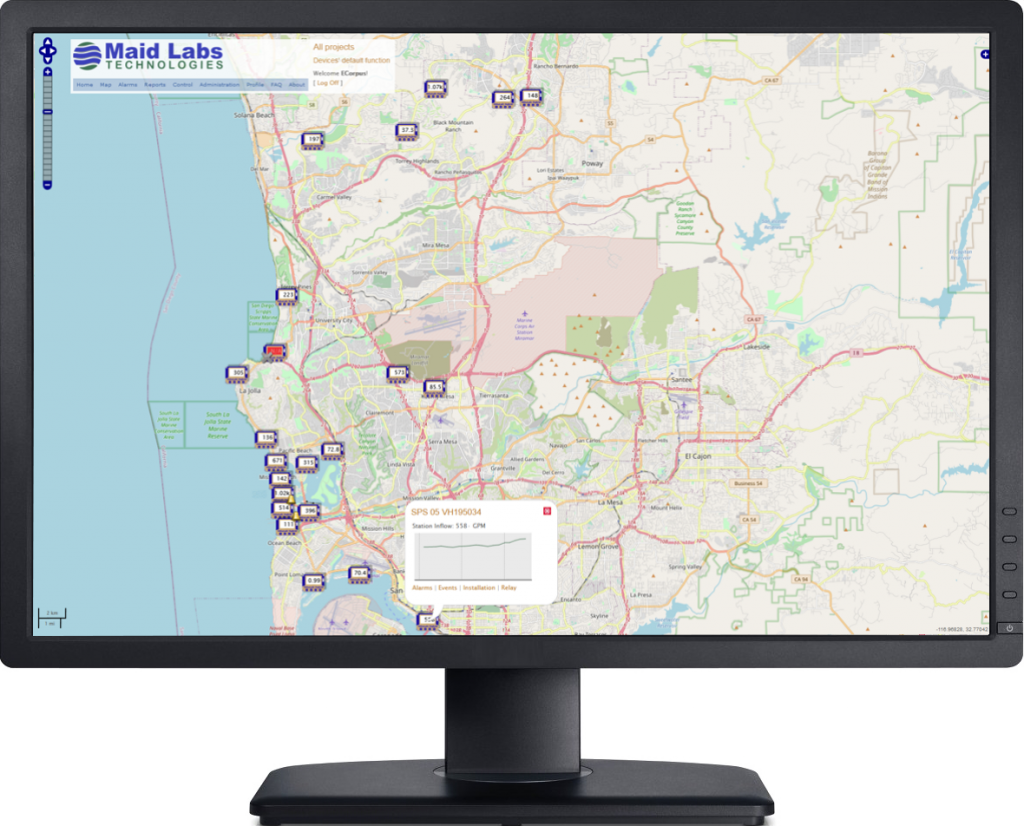
The instruments can be connected directly through the Ethernet port, Wi-Fi or Cellular modem. The data are transmitted to the server in real time or on a time-based frequency. When a value exceeds a warning or alarm limit, the values, warnings and alarms are immediately transferred to the MaidMaps server, which can send an SMS or email to the right person. The welcome page allows a user to select a field of interest, like Flow or Tap Water Pressure, then see relevant data all over the network.
Visual indicators like colors and icons are added to the instrument’s symbol and measurement to inform about communication and alarm problems, or when values exceed warning or alarm levels. If an abnormal value is displayed, clicking on the instrument’s symbol opens a micro-chart of the last hour and useful links like Alarms, Events and Relay.
Firewall Security
Both versions of the Volucalc Hybrid™, communicate via the Internet to the MaidMaps server. The instruments access the server like a computer downloads a web page. This way, the server does not need to break through firewalls to get the data from private locations when connected by Wi-Fi or cable. Instead of requesting a web page, the instrument transmits its latest data and receives back commands, new setups or firmware, if necessary.
MaidMaps™ has the following features:
The unlimited number of Maid Labs instruments are remotely viewed on a highly detailed web map. The data update frequency is based on individual instrument setup and cellular service costs. Changing displayed data types or accessing graphs is usually only 2 mouse clicks away. All data can be downloaded by the user. When an alarm occurs, a warning symbol attaches itself to the instrument’s icon on the map.
By continuing to use this website, you consent to the use of cookies in accordance with our Cookie Policy.